Welcome to Trading Methodology
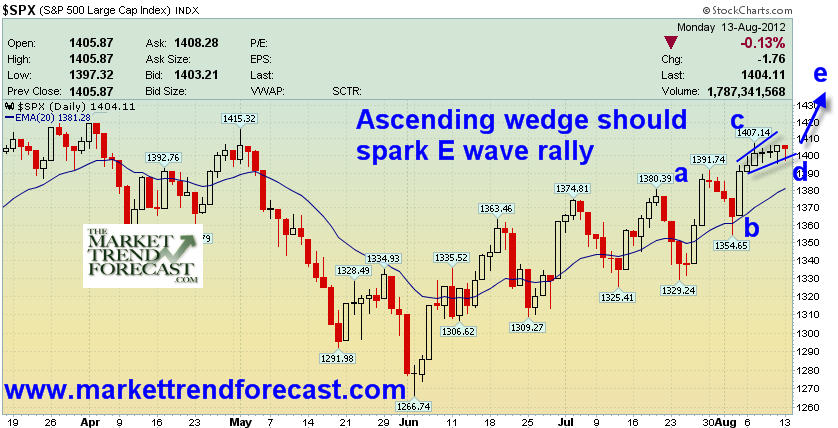
SP 500 “E Wave” ready to rally to Bull Market
. . . In recent trader updates we have been projecting a series of ABCDE waves to take the Bull market to post highs in the 1425-1445 ranges. The recent pullback was expected as what I was calling a “D wave” pullback, with an E wave to come. These final 5th waves or E waves can be extension waves or relatively benign, hence causing difficulty in forecasting the upper ranges.
In the case of the S&P-500 index, we have had a strong rally from the 1267 lows in early June to 1409 highs so far (The C wave highs) and recently a pullback into the 1390’s (The D wave). This next leg up should carry the market indices towards the 1440 2008 interim highs which began the last 5 wave down leg of the Bear cycle that ended at 666 on the SP 500. A case of down the mountain and up the mountain if you will since the 2008 highs to current pricing conditions at 1404.
Once this E wave completes in the 1425-1445 ranges (With an outside shot at an extension blast to 1495) we should expect a fairly significant correction of the entire move from March of 2009. This final rally leg could top anytime between Aug 13th and August 22nd as I last updated, with potential to spill over into early September.
A close over 1409 will confirm the “E wave” has begun in earnest and you may want to buckle up, as it could be the final blast before some rains begin to pour in the fall.
By-David Banister - www.markettrendforecast.com
If you’d like to be up to date on the daily and weekly views of the SP 500 and GOLD and Silver, get a discount at www.markettrendforecast.com or sign up for our free weekly reports.
70 Second Market Outlook – Metals, Dollar, Bonds, Stocks, Energy
Over the past year we have had some really interesting things unfold in the market. Investing or even swing trading has been much more difficult because of all the wild economic data and daily headline news from all over the globe causing strong surges or sell offs almost every week.
For a while there you could not hold a position for more than a week without some type of news event moving the market enough to either push you deep in the money or get stopped out for a loss. This has unfortunately caused a lot of individuals to give up on trading which is not a good sign for the financial market as a whole.
The key to navigating stocks which everyone thinks are overbought is to trade small position sizes and focus on the shorter time frames like the 4 hour charts. This chart is my secret weapon and giving you both large price swings which daily chart traders focus on while also showing clear intra day patterns to spot reversals or continuation patterns with precise entry/exit points.
While I could ramble on about why the stock market is primed for major long term growth from this point forward I will keep things short and simple with some 4-hour and daily charts for you to see what I see and what I am thinking should unfold moving forward from here.
For those of you who actively trade (or desire to learn how to trade) the financial and futures markets, there are a lot of other things outside the markets you should be following. But, I guess my bigger message is for those of you that aren’t in the futures markets, whether you trade them or not, the futures markets have a significant impact on what happens in the other financial markets, including forex, currencies, options and stocks. That’s why you should soak up every piece of good trading knowledge like a sponge in a quest to clearly see the bigger picture.
Keep in mind, the most accurate trading opportunities that happen week after week are the quick shifts in sentiment which only last 2-5 days at most which is what most of my charts below are focusing on…
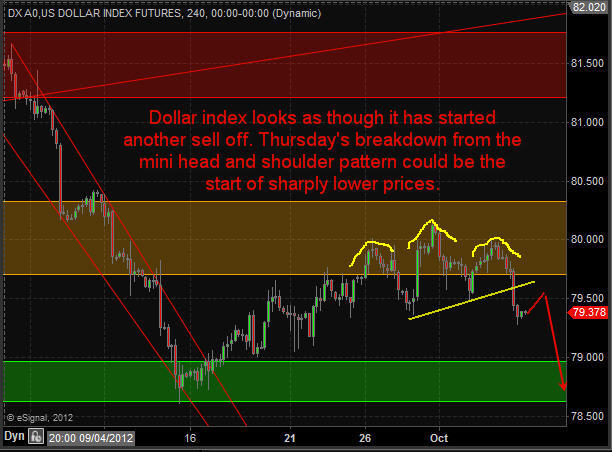
Dollar Index – 4 Hour Chart
This chart shows a mini Head & Shoulders reversal pattern and likely target over the next five sessions. The dollar index has been driving the market for the past couple years so a lower dollar means higher stock and commodity prices.
Dollar Index Trading
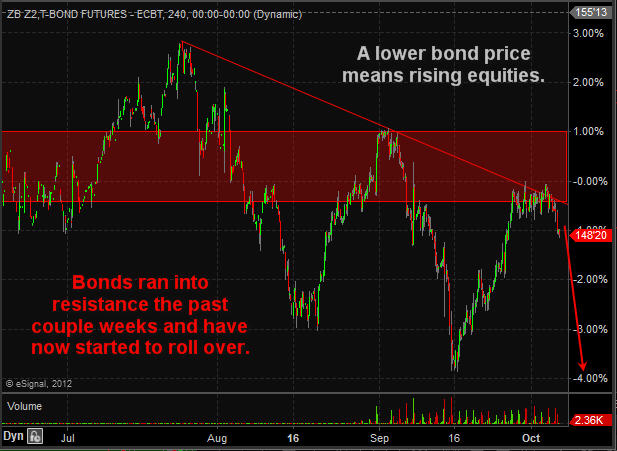
Bond Futures – 4 Hour Chart
Money has been flowing into bonds for the past couple weeks with most traders and investors expecting a strong correction in stocks. As you can see the price of bonds hit resistance this week and as of Thursday has now started selling off. Money flowing out of this “Risk Off” asset means money will move to the “Risk On” investments like stocks and commodities.
Bond Futures Trading
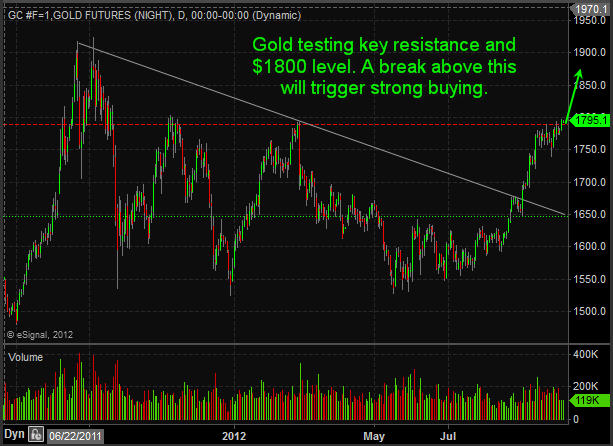
Gold Futures – Daily Chart
Gold is stuck in both categories in my opinion. It is a “Risk Off” safe haven when people are scared of falling stock prices, and it is also a “Risk On” speculative investment when people are feeling good about the market. Gold has been trading at key resistance for a couple weeks and looks as though it’s starting its next rally.
Gold Futures Trading
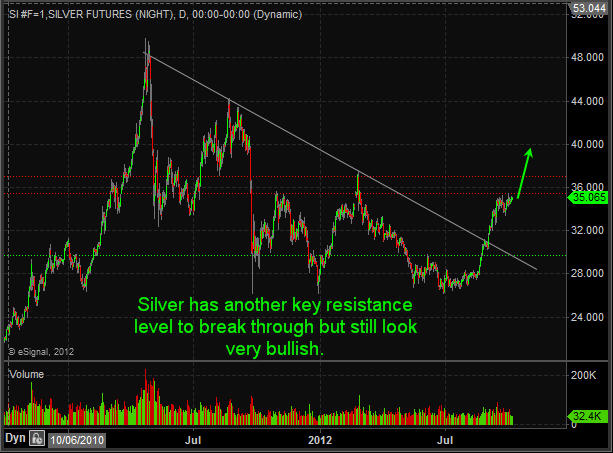
Silver Futures – Daily Chart
Silver is in the same boat as gold though it carries much more volatility than gold. Expect 2-4% swings regularly and sloppy chart patterns in this metal.
Silver Futures Trading
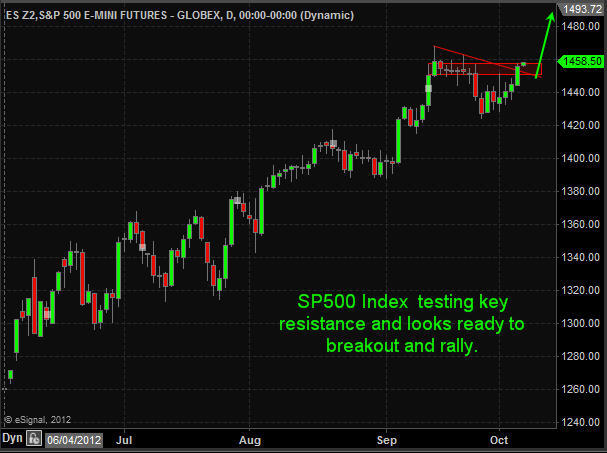
SP500 Futures – Daily Chart
As much as everyone hates to buy stocks up at these lofty prices I hate to say it but I think they are going to keep going up and they could do this for a long time yet. If the dollar index continues to break down then I expect the SP500 to rally another 3% from here (1500) in the next 1-2 weeks.
SP500 Futures Trading
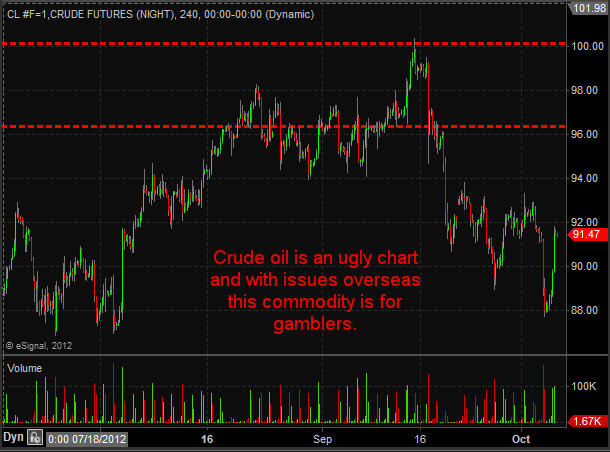
Crude Oil Futures – 4 Hour Chart
Crude oil has not had much attention from me in the past few months. While it has had big price action many of those big days took place on news causing an instant price movement making this extra dangerous to trade. I continue to watch rather than get attached to it.
Crude Oil Futures Trading
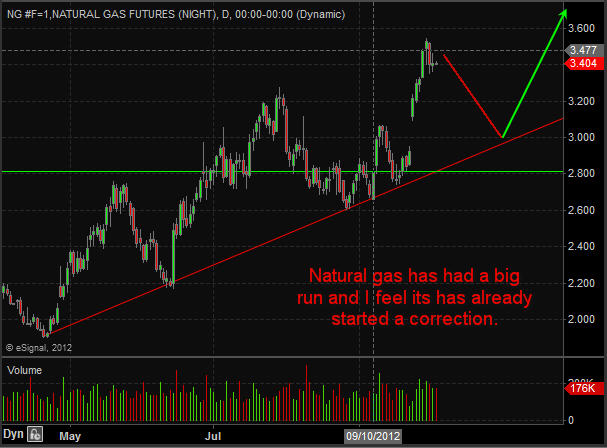
Natural Gas Futures – Daily Chart
Natural gas has been a great performer for us in the past 6 months as all the short positions slowly get covered. I just closed out my natural gas ETF trade this week with a 31.9% gain and plan on getting back in once the chart provides another low risk setup.
Natural Gas Futures Trading
Trading Conclusion
In short, I feel the dollar index along with bonds will correct over the next few weeks. That will trigger buying in stocks and commodities. Keep in mind natural gas dances to its own drum beat. The dollar does not have much affect on its price and most times natural gas is doing the opposite of the broad market. Get My Pre-Market Trading Analysis Video and Intra day Chart Analysis EVERY DAY – www.TheGoldAndOilGuy.com - Chris Vermeulen
Recommended Trader Resources
Today's Date and Time