What the GLD ETF Chart Tells about GOLD
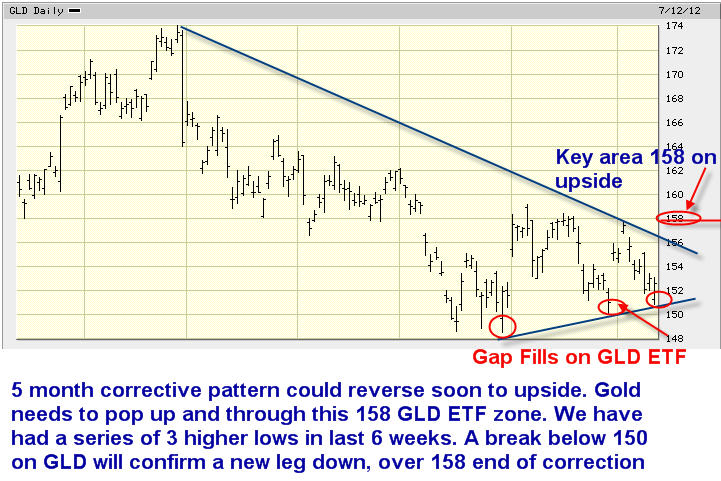
Gold had remained in a rough 1550-1640 range for several weeks now. Tonight, we look at the GLD ETF, which represents the Gold spot price movements. Over the past 5 months we can see in the chart below the clear downtrend lines.
Recently, in the past 6 weeks we have seen a series of 3 higher lows including today where a lower gap filled in and then Gold reversed upwards.
What Gold needs to do, in terms of this GLD ETF is clear the 158 hurdle on a closing basis to set up a stage for a new advance. I would expect in the intervening months to October for Gold to continuing meandering and correcting to as low as 1445-1455, my longstanding Gold worst case low targets I’ve had since last September.
Near term key levels are 150 on the downside and 158 on the upside. If we close below 150 on GLD ETF then we should be looking for my 1445-1455 areas to be hit this summer before a low. If we clear 158 on the GLD ETF, then the triple bottom at 1520 is likely confirmed and we can start tracking some upside for Gold.
By David Banister - Join us at www.MarketTrendForecast.com and sign up for free weekly updates. Alternatively, you can use our 33% discount on that page to subscribe and receive 4-5 updates per week on US Markets, Gold, and Silver!

![]()