The S&P 500 is Plagued with Divergences
By now everyone has a prediction about where the S&P 500 Index (SPX) is going to be heading in the future. Most of the sell side and their ilk are all rolling out the green bullish carpet and predicting that a major bull run is right around the corner.
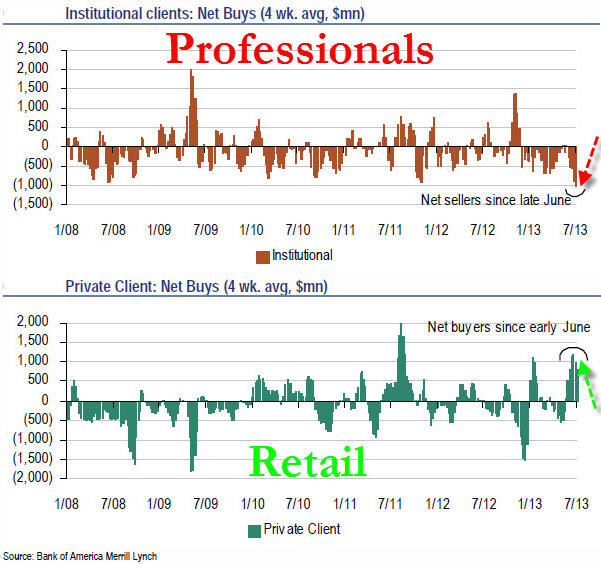
I am a contrarian investor by nature and I tend to sell when others are buying. When retail investors are buying and the professional sell-side is quickly reducing their long equity exposure I get increasingly more bearish. A recent report from Zero hedge shown - "https://www.zerohedge.com/news/2013-08-05/us-retail-investors-alone-rotate-all, was accompanied by the charts shown below courtesy of Bank of America Merrill Lynch:
As can clearly be seen above, retail investors have been strong buyers as of late while the institutional or professional investors have been sellers. The institutions almost always are net sellers near market tops while the retail crowd buys up the professionals' inventory at high prices only to sell lower. The sheep are coming to the slaughter, they just do not know it yet.
Using a more quantitative methodology, it becomes apparent that the probabilities are not favorable for a significant bull run to emerge as we edge toward the back half of the year.
As a professional options trader, I focus on probabilities to help guide my investment thesis. One of my favorite underlying indexes to monitor for probability based moves is the S&P 500 Index (SPX).
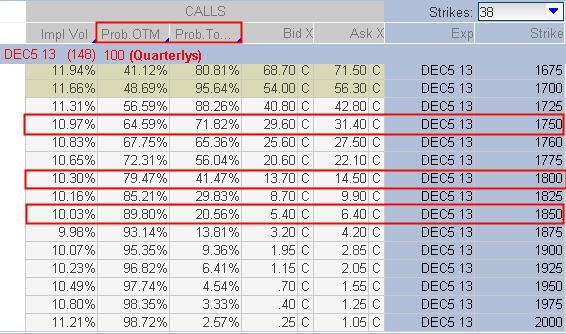
The probabilities shown below were derived from statistical calculations based on the SPX option chain that will expire December 31, 2013.
As can clearly be seen above, the probability that price will close at the end of this year above 1,750 on the S&P 500 Index (SPX) as of Monday's close was roughly 35%. Based on current implied volatility, there is a nearly 72% chance that we will trade up to 1,750 before the year is over at some point in time.
Again, referring to the SPX option chain shown above, there is a 20% probability that price will close above 1,800 on the last day of the year with only a 41% chance that price will reach 1,800 at any point from now until December 31, 2013.
The numbers go down considerably when we begin to look at the probabilities of reaching 1,850 on the SPX. The probability that price closes above 1,850 at the end of this calendar year is less than 10%. However, the probability we touch the 1,850 price level at some point later this year is around 20% based on current implied volatility levels.
The SPX option chain is telling us that this monstrous move is unlikely to be able to hold through the end of the year based on current implied volatility levels. Clearly these levels will adapt to market conditions as they change every day during normal market hours, but at this point they are not providing a strong indication of significantly higher prices before year end.
By now readers are probably expecting me to make a prediction about where prices are going to be headed. I do not do specific predictions because I do not feel that I know anymore than anyone else regarding future price action. However, I do believe we are closing in a topping pattern that is likely to give us a strong correction sometime before year end.
In addition to the professional versus retail investor charts and probability based determinations for future price expectations, there are two more indicators which are showing a divergence or a non-confirmation signal from the price action in the S&P 500 Index (SPX).
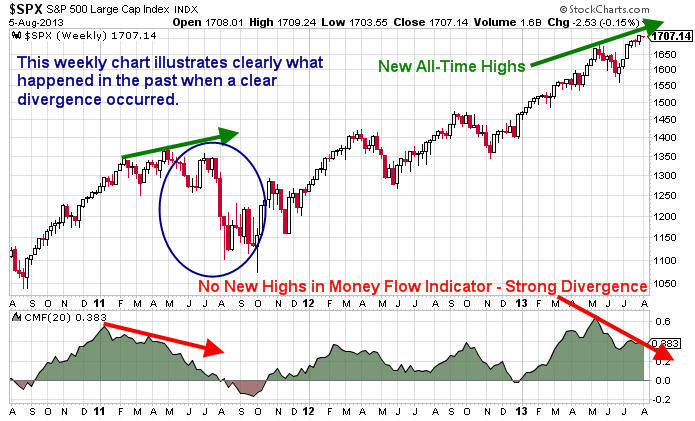
As shown below, the money flow indicator has failed to break to new highs as of today (Monday) which thus far fails to confirm the recent move to new highs in the S&P 500 Index (SPX).
The chart above does not require much explanation. The last time we witnessed a major divergence was in the autumn of 2011 which culminated into a nasty correction.
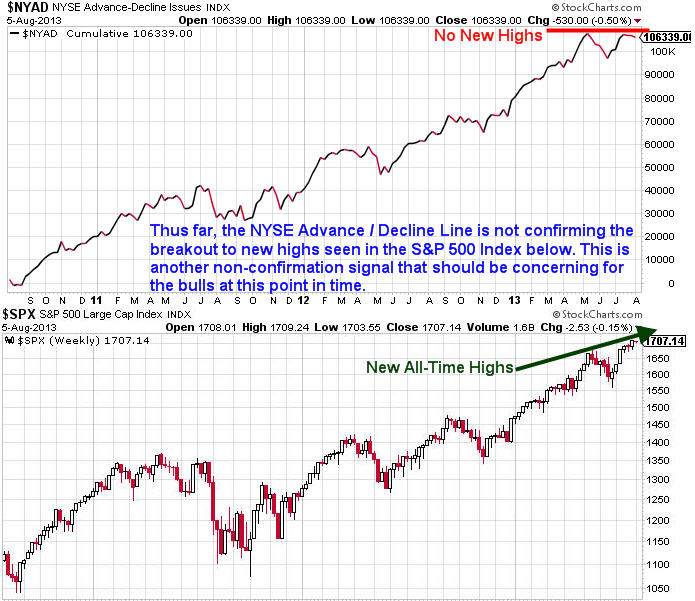
In addition to the divergence shown above in the Money Flow Indicator, there is also a strong non-confirmation signal in the NYSE Advance / Decline Index which is shown below.
I want to be clear to readers that I am not trying to imply that prices are going to collapse tomorrow or even in August or September. I am simply trying to point out through the use of a variety of analytical methodologies that buying here is a rather risky endeavor.
While more upside may await in the short-term, the intermediate term could be plagued by strong selling pressure. One thing is certain, I expect the selling pressure to come out of nowhere and the retail crowd will most certainly be left holding the bag. Risk is high.
If you are looking for a mathematical and statistical based approach to trading, OptionsTradingSignals.com may be a perfect fit to improve your option trading results. Give OptionsTradingSignals.com a try today!
This material should not be considered investment advice. J.W. Jones is not a registered investment advisor. Under no circumstances should any content from this article or the OptionsTradingSignals.com website be used or interpreted as a recommendation to buy or sell any type of security or commodity contract. This material is not a solicitation for a trading approach to financial markets. Any investment decisions must in all cases be made by the reader or by his or her registered investment advisor. This information is for educational purposes only.

![]()