![]()
Daily Commodities Update: No Lead Gasoline
No Lead Gasoline has been trending slightly lower on the intraday 15-, 30-, and 60-minute time frames. This bearish sentiment helped form a Channel Down pattern, which is currently being broken to the upside. The pattern reversal and the short-term downtrend occurred at 21644 (E), the point at which No Lead Gasoline rallied through downtrend line resistance.
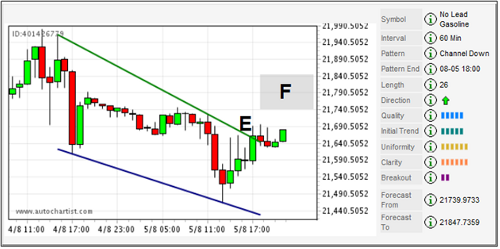
The reversal, which triggered an Autochartist Reversal of the Trend (ART) buy entry, was set up within a distribution market cycle, as seen by the five-bar Autochartist Initial Trend reading. A distribution cycle is characterized by a wide, volatile range that typically exhausts at near-term highs and lows. This makes the previous high at 21750 a likely exhaustion point. This level is also within the Autochartist Forecast area between 21874 and 21739 (F). Look for an overbought Stochastic indicator as prices approach the Forecast area, and for No Lead Gasoline to stall and possibly form a double top. The two-bar Breakout reading confirms that weak bullish momentum accompanied the pattern break, which further increases the likelihood for a stall.
Daily Forex Update: USD/CAD
On the daily chart, the USD/CAD created a double bottom when it reached a low at 1.0109, surpassing the previous low by 30 pips. Regardless, prices found buying support and rallied higher, leaving behind a long candle wick and forming a Hammer pattern and, possibly, a Morning Star candlestick reversal pattern. This daily chart reversal from Thursday’s lows also triggered a 30-minute downtrend reversal of a Falling Wedge pattern when prices pierced 1.0145 (E).
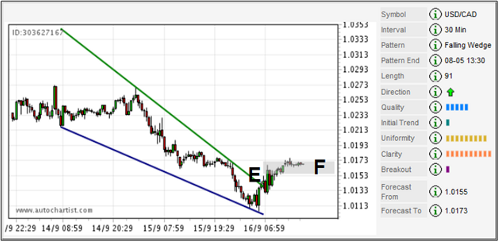
The climb higher took the USD/CAD to the Autochartist Forecast area waiting between 1.0155 and 1.0173 (F). This range is resistance, and currently contains the low bullish sentiment that helped break the pattern; the low momentum that accompanied the reversal is confirmed by the one-bar Autochartist Breakout reading. The 30-minute USD/CAD is now trading within a narrow, sideways range as traders and investors determine what will be the next direction for this pair as Friday’s important Non-Farm Payroll number release approaches. The one-bar Initial Trend has set up what could be a momentum entry, depending upon whether the bulls or bears win the battle from the Forecast range.
Daily Index Update: FTSE 100
The FTSE pushed higher today, approaching the high at 5435 from May 14. Thursday’s session high at 5416 is important, as it finally proved that the bulls could break the ten-day congestion on the daily chart in order to create a higher high intraday. However, this bullishness should be tempered by the fact that prices pushed lower and drove the FTSE to a close at 5365. This price action also confirmed the Ascending Triangle pattern’s up trend line support at 5367 (A) on the 60-minute time frame.
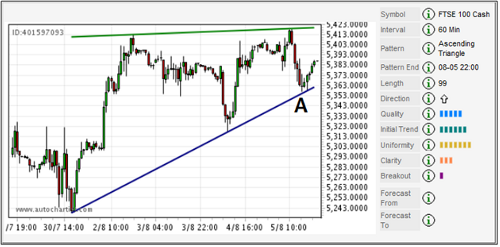
The 60-minute chart indicates a weak uptrend, which is confirmed not only by the six-bar Autochartist Initial Trend reading but also by the up trend line bounce. Triangle patterns are congestion-to-consolidation patterns that form within a sideways market cycle. This pattern, with its strong uptrend line support, can be traded with a trend-following set-up—the Autochartist Retracement/Correction (ARC) entry. This entry relies on support holding when the up trend pulls back. Look for more upside continuation leading to exhaustion at the Triangle’s top line at 5420.
Daily Commodities Update: Lean Hogs
The intraday chart of Lean Hogs broke lower through the support of a Triangle pattern on the 15-minute time frame. The breakdown triggered an Autochartist Initial Movement/Momentum (AIM) entry as selling pressure pushed prices through 7888 (E). This move was accompanied by strong bearish sentiment, as confirmed by Autochartist’s seven-bar Breakout reading. Notice how quickly prices accelerated to the downside: this is the result of strong momentum at the pattern break.
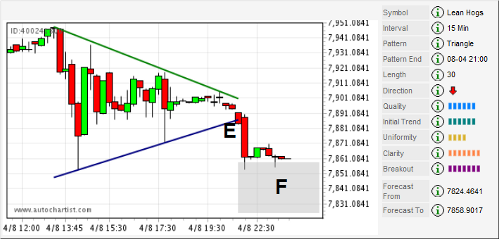
The Initial Trend reading will dictate how the move should be managed. The six-bar reading indicates a weak trend on the 15-minute chart; as a series of higher lows preceded the formation of the Triangle pattern, the trend is slightly up—this means that a continuation of the uptrend is possible should prices continue to hold at the Autochartist Forecast area between 7858 and 7824 (F).
Daily Forex Update: USD/JPY
The USD/JPY recently broke above the downtrend line resistance of a Falling Wedge pattern on the 240-minute time frame. This reversal higher has triggered an Autochartist Reversal of the Trend (ART) entry long, because prices have rallied through 86.05 (E). This momentum is further propelled by the break through the “big figure” level at 86.00, which—like all whole, round numbers—typically sees a larger amount of orders.
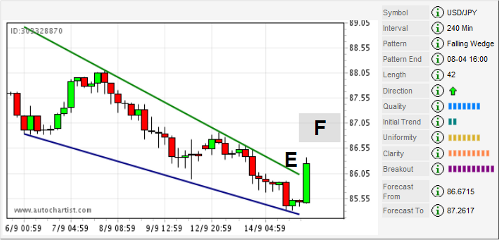
The Autochartist Length reading for this pattern alert should be considered, as it’s a relatively short one at just 42 candles. This means that the overall downtrend that has been in place since the USD/JPY sold off from 89.00 is not reflected in the two-bar Initial Trend reading, which indicates that the short-term market direction is more sideways than bearish.
The nearby Forecast area waiting between 86.67 and 87.26 (F) overlaps with the recent high at 86.88, and will likely form an intraday double top if selling pressure keeps the USD/JPY from moving higher through 87.00.
Daily Index Update: Switzerland Blue Chip
On the short-term 15-minute chart, the Switzerland Blue Chip index has rallied higher after prices were able to break above the intraday resistance between 6337 and 6348. However, as prices are trading at uptrend line support of a Rising Wedge pattern that has an Initial Trend reading of just a single bar—pointing to a non-trending market—the current rally seems to have lost bullish momentum.
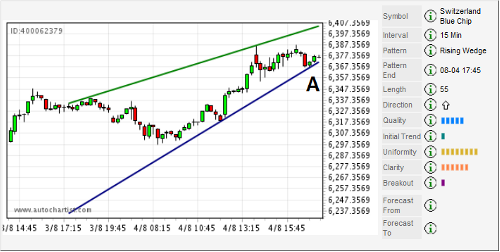
The lack of trend and the likelihood that the 15-minute chart has transitioned into a sideways market cycle increases the possibility for a short entry should prices drop through 6370 (A). This would also trigger an Autochartist Reversal of the Trend (ART) pattern reversal that could push the index lower towards the previous intraday resistance—this prior resistance will now be support between 6337 and 6348. Since the daily time frame is in a wide, sideways market cycle known as distribution, and because it is trading near the high of the range, look for exhaustion to push the Switzerland Blue Chip index lower.
For further information on this and other Autochartist products visit www.autochartist.com