Position Trading or Day trading?
Finding Approach Which Works Well For You
Analysis Tools
The availability of quality analysis tools is an important variable that, in general, gives an advantage to position traders. This is because position traders are likely to use long-term technical analysis in conjunction with fundamentals for evaluating trading opportunities. This contrasts to intra day systems that rely on very short-term technical signals that reverse themselves time and time again over the course of the day.
From my own experience, and with the support of many analysts, market fundamentals are key to determining what is and what isn't a good trade. Does this mean day traders can't use fundamentals? Absolutely not! Day traders are not required to disregard longer-term trends and fundamentals. I dare say many of the CSI customers who are day traders have made the connection between long-term analysis and intra day profits. Those day traders who rely solely on tick-by-tick systems are adversely affected by limiting the scope of their analysis. Whether trades are signaled by technical indicators, pure fundamentals or hunches, and whether they are executed on a short-term (near real time) or end-of-day (position) basis, the best results come when trades are in the direction suggested by reliable fundamentals. For any trading style, you will usually get a better ride by first doing your homework.
The homework amounts to using fundamentals to determine the expected directional movement of related markets in general and of the traded market in particular. Once this is known, you can improve your odds greatly by trading in the direction suggested by the fundamentals. Many of these fundamentals are readily available from the Unfair Advantage platform, so they are accessible by all CSI subscribers at no extra charge. Access to some of the information requires a visit to the CSI website. There you will find key statistical offerings provided only to our customers.
Here are some precise trade-directional tips that reveal fundamental influences on both long-term and very short-term positions:
1) Heavy volume or open interest in any market very often leads to further movement in the same direction. The CSI database holds daily price, volume and open interest data on every world futures market and most popular stocks and options. Use these vast data resources to learn about all things financial.
Tip #1 - As you can see in this chart, heavy volume or open interest in a market often leads to further movement in the same direction. Note the price movement on days with tall volume bars. Price movement on the subsequent trading day nearly always follows through in the same direction.
2) - Increasing put/call ratios of the corresponding tradeable vastly increases confidence that a move will be sustained. CSI offers all world futures options and all stock index options. This very important and rare database makes CSI customers uniquely capable of analyzing put/call ratios.
3) - Strong moves in markets that are negatively correlated to the market you'll be trading strongly suggest movement in the opposite direction for your market. As any regular CSI website visitor knows for sure, you can get an immediate list of all stocks and/or all world Futures Markets correlating positively and negatively with the given market you have chosen to trade. Such information will become invaluable in deciding the likely directional movement of a given market. When using the website correlation tables, there is no need to match up stocks with stocks or futures with futures. Your tradable market of interest may be paired with any market regardless of type.
4) - The level of correlation displayed is provided as a positive or negative quantity which ranges from minus 1.000 to plus 1.000. This is a statistical quantity and it happens to be a highly useful measure of association between the market you plan to trade and any other correlated market that suggests some significant causal influence.
Tip #4 - Markets that are positively correlated with the trading market you plan to trade have sustaining directional effects on your market when the independent, correlated market leads your market.
5) - If a correlated market is expressed as a foreign currency, be sure to convert the underlying currency to the currency of your market before evaluation. This is something you won't find in most competitors' software.
6) - Be aware that some commodities and futures exhibit tendencies to be "forward markets" or "backward markets." In forward markets, distant contracts have higher values than near contracts. The reverse is true for backward markets. Use this knowledge to your advantage.
7) - Markets traded in different units than the proposed market to trade should be normalized into a form whereby a common unit exists for both markets. For example, if you are trading cattle, which is expressed in cents per pound and you have found that gold trading, which trades in dollars per ounce, strongly correlates with cattle, you should convert your gold prices into a comparable cents per pound scale so that comparisons can be based on a common unit of measure. Then normalize the gold market data to force it to appear in the same units as the cattle market over a moving number of days. (We suggest 1-year.)
8) - Introduce as much daily historical evidence as is made available through Unfair Advantage (over 50 years in the case of the CBT corn market) and factor in all available history through the current date before making a judgment on the future directional movement of the proposed market. The lengthy historical period will help you to prove your theories before you launch your trade.
9) - Commitments of Traders (COT) data is among the fundamental facts you should consider before making a trading decision. CSI provides the full history of all important trader information on regulated commodities through the Commodity Futures Trading Commission (CFTC) report on the weekly USDA's C.O.T. report. This data, available to CSI subscribers, identifies the breakdown by open interest category of Large Traders, Small Traders, and Commercial traders. This invaluable resource provides a directional forecast of price movement for the most basic products to the U.S. economy. It is usually unwise to take a position in the market that is contrary to a unified commercial hedging position, as visible with the COT Index, but exceptions could occur. The broad directional coverage supplied should be consulted before any futures position or any related stock position is taken.
Tip #9 - Commitments of Traders (COT) data identifies the breakdown by open interest category of Large Traders, Small Traders, and Commercial traders, revealing the outlook as interpreted by insiders and professionals. Commercial interests often lead the market.
COT data is provided by publisher Steve Briese (www.InsiderCapital.com) in a modified form through The Bullish Review. Mr. Briese accepts subscriptions to his analysis of these numbers and related factors.
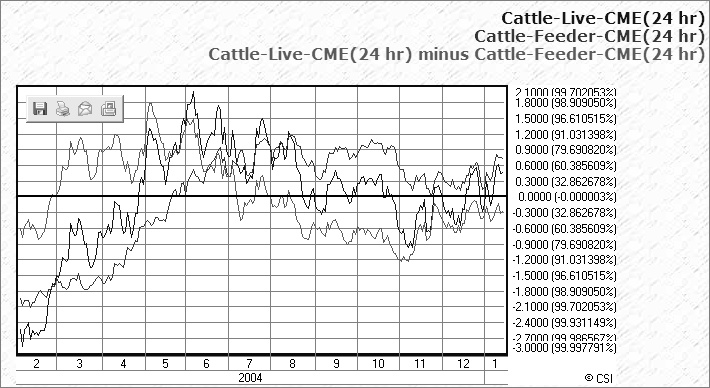
10) - Most markets have their complements. Live Cattle, for example, should be studied on the basis of Live Cattle options, the C.O.T. preferences over time, the put/call ratio of Live Cattle Options which measure immediate strength, the Canadian Dollar, which correlates negatively with Live Cattle, Feeder Cattle, which correlates positively with Live Cattle, and Feed Wheat, which correlates negatively with Live Cattle. You should also compare contract delivery months against each other. Don't forget to study the cash market as well.
11) - The seasonality of any related market's price behavior is another factor that should be considered before taking a position. CSI's seasonality study is a remarkable forward-looking tool that projects the behavior of any market into the future. Every market traded in every futures exchange on earth is covered through this dynamic seasonal study for the full period of historical resources reaching backward in time for decades. In all proposed trading opportunities, UA's seasonal study is a "must check" input.
Tip #11 - This two and 1/2 year chart of Perpetual Contract data for Heating Oil shows market movement (above) and the seasonal waveform below. The positive projection for the coming year is displayed in standard deviation units at the right side of the chart.
12) - Use filtering tools. CSI's MarketScanner module (within the UA product) can be used by position traders or day-traders to isolate stocks that have similar technical characteristics or stocks that exhibit desired fundamental properties. You can scan and view all futures, all stocks, all stocks of a particular exchange or just the content of your portfolio(s). The scanner provides access to many categories of fundamental data and allows you to filter, sort and rank by fundamental and/or technical values. Use MarketScanner to look over and evaluate the field of possibilities before taking on any position. You'll be glad you took advantage of this capable product which is FREE to every Unfair Advantage subscriber.
Tip #12 - The above graphic shows MarketScanner and a sampling of studies and indicators available for filtering and sorting.
Use all of the above to learn how to trade from decades or at least a dozen years of past history. Then put everything together into a single package, and you should have a great chance to prevail with whatever approach you choose.