Closing in on an SP 500 Top
The SP 500 has been in Major wave Elliott Wave 3 up of Primary wave 3 from 1267 by our best projected counts. Our technical analysis of stock trends predicted back in early September a large rally up in the SP 500 to 1822-1829, which we managed to see hit just 3 months later from the mid 1600’s.
Recently, the market had a bit of an extension higher than our original 1822-29 pivot projections, but we see possible trouble ahead. Our Elliott Wave Theory interpretation is based on Fibonacci sequencing, Investment Advisor sentiment surveys, traditional technical analysis patterns and more.
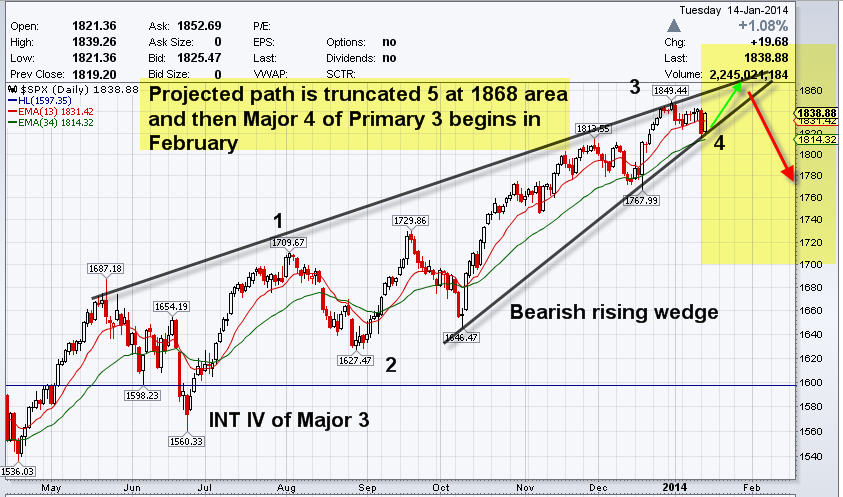
The stock market is climbing here now likely in a final 5th wave of Major 3 and we believe it may truncate or be shorter than normally expected. We also have a rising bearish wedge from the Intermediate wave 4 lows of 1560 for Major wave 3 structure, which is a classic topping pattern for the markets in general.
Our view is that the SP 500 Index or the market should top out around 1868 and then begin a Major Elliott Wave 4 correction in February, and at the same time GOLD and SILVER are forming bottoms now and will begin strong moves up in February.
Much like our Kitco.com piece in early September called for a Top in GOLD and a Bottom in the SP 500 at the time, we see the opposite nearing now.
Below is our updated best projection on the SP 500 market trend analysis and near term action, with potential of course for a blow off reversal top over the 1868 area. For now we would watch 1868 and we would be buyers of GOLD as we have been saying for several weeks during this final window into early February.

Join us at www.markettrendforecast.com for regular updates on the SP 500 and Precious Metals - David Banister