How to Trade Market Bottoms for SP500 & Gold
The stock market topped in April which was expected from analyzing stocks and the indexes. Back in April I posted a few reports explaining how to read the charts to spot market tops. Today’s report is about identifying market bottoms.
It does not get much more exciting than what we have seen in the past 2 months with the market topping in April and the May 6th mini market crash. This Thursday we saw panic selling which pushed the market below the May 6th low washing the market of weak positions.
For those of you who have been following me closely this year I am sure you have noticed trading has been a little slower than normal. This is due to the fact that the market corrected at the beginning of the year and we went long Feb 5th and again on Feb 25th. Since then the market rallied for 2 months and never provided another low risk entry point. In April the market became choppy and toppy and we eventually took a short position to ride the market down. Now were we are looking at another possible reversal to the upside.
Only a few trades this year which I know frustrates some individuals but if you step back and look at my trading strategy you will learn that we only need to trade a few trades a year to make some solid returns. I don’t know about you but I would rather trade a few times a month and live life between trades… not trade all day every day getting bug eyed in front of the computer.
Ok enough of the boring stuff let’s get into the charts…
SP500 – Stock Market Index Trading ETFs & Futures
The pullback in the broad market was expected but the mini crash on May 6th really through a wrench into things for us technical analysts. We don’t really know the truth about what happened that day… was it just a simple error or was it a planned error for the US government to take a massive short position to move something in their favor quickly to generate MASSIVE gains? It leaves us technicians hanging wondering if that was a shift in trend from up (accumulation) to down (distribution)?
My thoughts are if the crash was truly an error then we will see months if not another year of higher prices… But if it was a planned sell off with banks moving to the sidelines then we are most likely headed into another bear market. Personally it does not matter what happens as big money will be made in either direction. Problem is if we do go into another bear market then the majority of individuals will lose capital as investor’s portfolios get smaller and smaller. That will lead to a lot of depressed people…
In short, I am neutral on the stock market for the intermediate and long term. Once we have a few more months of price action only then will I have a plan for longer term investments. But on the short term time frame the market is screaming at me with extreme sentiment levels lining up on the stock market and gold.
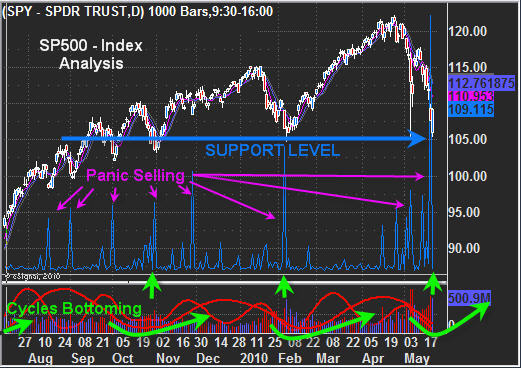
The daily chart of the SPY – SP500 Index shows several important points which help me time market bottoms. We have prices trading at a support zone. Buyers step back into the game here and should provide a decent bounce which started Friday Morning.
Next we have the panic selling spikes from an indicator I created. Generally the day after we see panic in the market like we did on Thursday we will see a big bounce and many times a large rally.
Down at the bottom you can see my custom market cycles which are both starting to bottom. During times like this the market has a natural tendency to move higher.
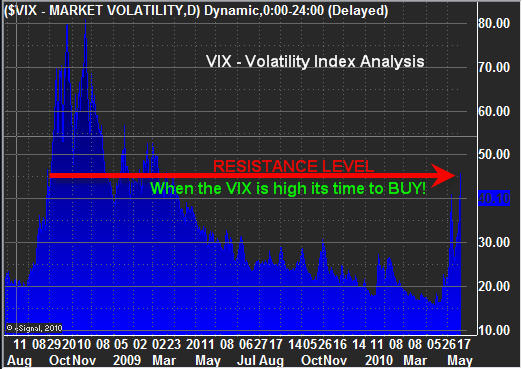
VIX – Market Volatility Daily Chart
The VIX has an old saying “When the VIX is high its time to buy, When the VIX is low, its time to go”. Simple analysis clearly shows the VIX trading high and at a resistance zone.
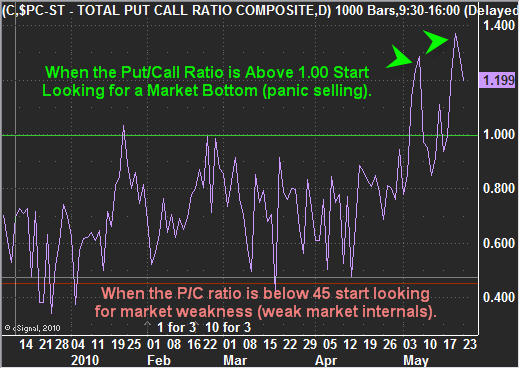
Put/Call Ratio – Daily Trading Chart
This chart measures the amount of put and call options traded each day. When it is trading over 1.00 then we know for every 1 call option traded (wanting the market to go up) there is 1 put option traded (wanting the market to go down). Over 1.00 is extreme and when that many people are bearish and using leverage to profit from a drop in price then in my opinion it means everyone has already sold and the selling pressure is about to end.
Actually if you go back in time and review SP500 and this ratio you will notice 2-3 days after this ratio reaches 1.00 or higher the market bounces/bottoms.
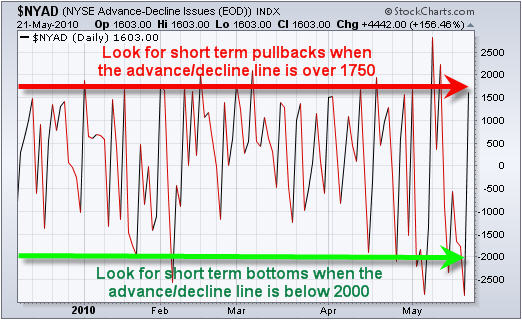
NYSE Advance/Decline Line for Equities – Daily Chart
This chart shows us how many stocks are advancing or declining on any given day. When extremes are reached look for a short term bounce or bottom 1-3 days following.
How to Identify Stock Market Bottoms with Simple Analysis:
In short, I feel the market is forming a bottom here. How big of a rally will we get? I don’t know because of the mixed signals from the May 6th EXTREME heavy volume selling session. As usual I focus on trading with the trend, trading the low risk setups and I manage my money/positions scaling in and out of those positions as I see fit.
If you would like to receive my Real-Time Trading Signals & Trading Education check out my website at www.FuturesTradingSignals.com
An update on the Gold Bull Market and the SP 500 Index
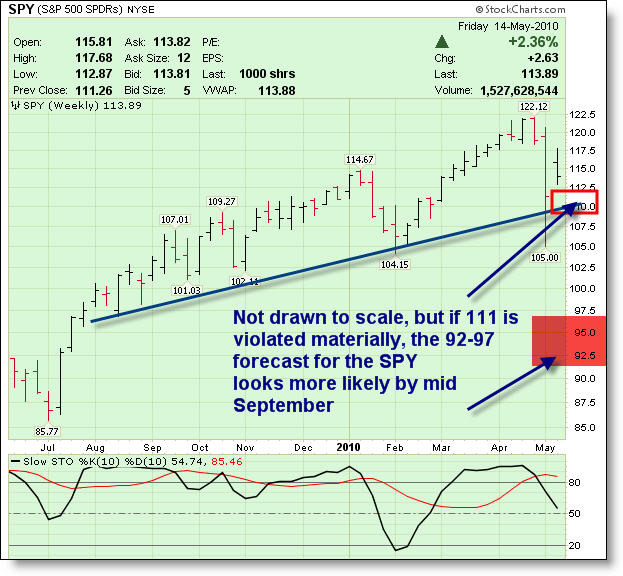
Back in the third week of April I predicted here on Kitco.com a topping in the broader market indices. The theory was the VIX levels were extremely and historically too low concomitant with extremely high historical readings in investor bullish sentiment gauges. After thirteen Fibonacci months of a bull cycle rally, it was likely an A B C correction to the downside would begin. In further follows ups on TheMarketTrendForecast.com service I run on April 20th, I again outlined concerns with falling volumes on small cap stocks and too many “stories” being run up too far ahead of the economics.
At this point in the Bull market, it is common to have the crowd of investors move from a bias towards viewing all news as positive, to a negative slant on all news. Nothing has changed dramatically on the problems the world had before with Debt and currencies, but the reaction to those events turns negative. This works off the overly optimistic Elliott Wave patterns of the crowd, turning into a typical Zig Zag correction that lasts several months. There will be trading opportunities between that Mid-April topping forecast and my forecast for a bottom around mid-September. However, as recommended in April, Index investors and mutual fund investors should have been moving to the sidelines. I am looking for the SP 500 Index to drop to the 920-970 areas by mid-September before the next leg of the Bull market takes off. Now, the one caveat to that forecast is actually a lot more bullish. If the SP 500 can hold the 1100-1110 areas and pivot up strongly, we could move on to new highs. I put the likelihood of that around 20%, so be on guard. A counter-trend rally up in the next few weeks is highly probable, but the evidence continues to suggest working our way down into the 900’s in the SP 500 before the Bull resumes in earnest. We are selectively buying Gold and Biotech stocks in the Active Trading Partners service as well.
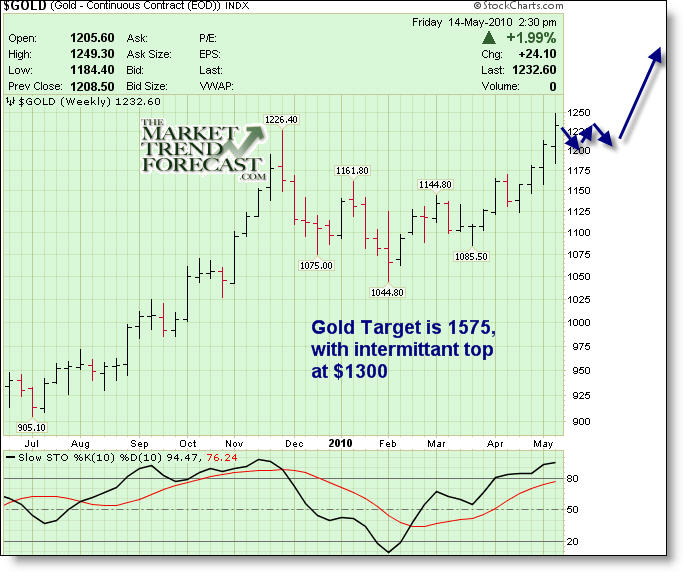
Gold has continued higher confirming my April 20th forecast on www.TheMarketTrendForecast.com a move from 1125 to 1235 in Gold. The Elliott Wave patterns remain extremely bullish for Gold to continue a 13 Fibonacci year cycle up into 2014. Gold has formed a very bullish pattern intermediately for a move to $1470-$1550 at the next major pivot top. In the interim, I expect continued consolidation in and around my $1,235 US levels before the next pivot high at $1300-$1,325 US. Fiat currencies are burning matches as foreign governments and other entities continue to attempt to put out a fire by printing more paper and covering the same fire with it. Until the analysts on CNBC stop questioning the validity of Gold and start questioning the validity of Fiat Paper, the bull will rage onwards with most of the pundits watching the caboose from the back of the tracks.
Gold Update Forecast- 1300 pivot likely after consolidation, with 1570 US later on:
 Precious Metals & Oil ETF Trend Trading
Sunday April 18, 2010
Last week was exciting with broad market and gold forming an intraday reversal pattern after a long overbought rally, then broke down though short term key support levels. While this move lower was tough on the pocket book for those who chased the market up the past few days and/or were not moving their protective stops up, this move is good for the health of the market.
This pullback is actually a good thing for us active traders who wait for low risk setups and don’t chase prices higher, but rather buy on the dips in a bull market when most of the risk has been flushed out already. Trading with low risk setups is not the most exciting type of trading because there are not a ton of setups but if one can be patient and wait for these plays it is a very profitable strategy in the long run.
Those traders who live and breathe the market focusing on trading intraday price action most likely made a small fortune last week with Fridays sell off in stocks and precious metals.
Below are the charts showing what I am currently thinking is going to happen for gold, silver, gold stocks and oil. I will be tracking the market with intraday charts to help pin-point a low risk entry point for a possible short or long position as the market unfolds this week.
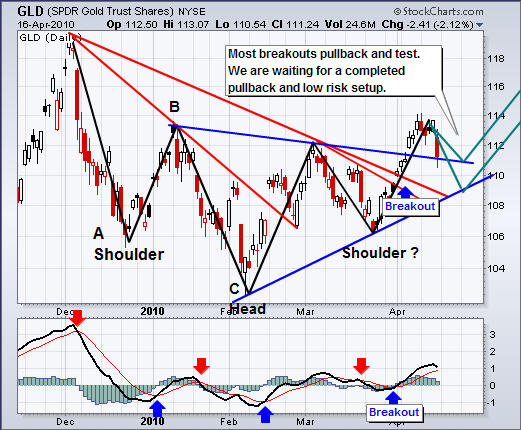
GLD – Gold Trading ETF
The chart below is an updated chart which I have showed several times. It shows how gold corrected, bottomed and is now trending back up. This week I will be watched closely to be sure we take a position which has the highest probability of working in our favor if and when a low risk setup occurs.
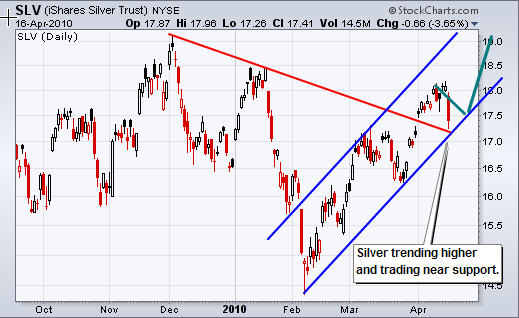
SLV – Silver Trading ETF
Silver really took a hit on Friday. It is now trading near support but there is not much we can do until we see what happens on Monday. There could be a bounce or more down side, tough to call right now…. And it’s not something you want to be on the wrong side of.
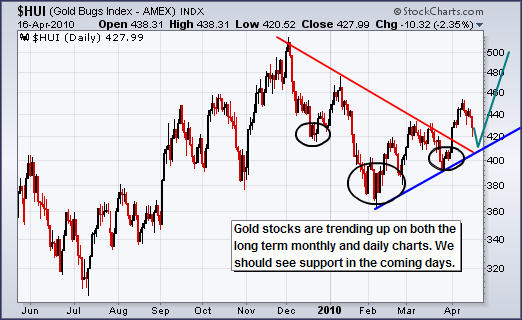
Gold Stocks – Gold Stock Trading
Gold stocks did not drop as much as I thought they would which indicates the market is still very bullish on gold. There is still potential for more downside… so I am letting the market unfold before doing anything.
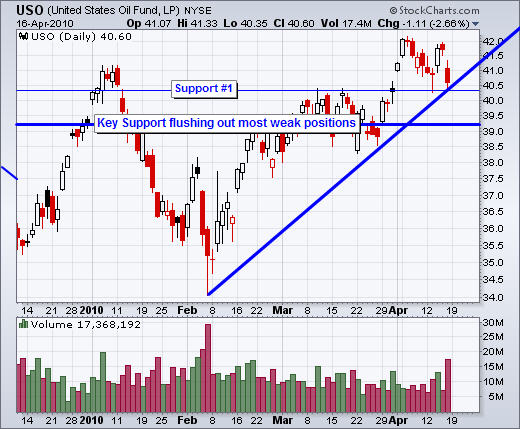
USO – Oil Trading Fund
You can see oil moved down sharply on Friday and is now testing both a price support level and trendline support. Although this looks like a perfect setup, the market is designed to shake people out of positions before continuing the move. So it is likely for oil to dip which would break both these support levels triggering stop orders. Then the price should drop to the key support level where support should be found for at least a bounce or a new bottom.
Precious Metal & Oil ETF Trading Newsletter:
In short, the market had a nice correction on Friday and the heavy selling volume indicates that we are getting close to a larger correction which should provide two swing trades, a shorting opportunity and a new buying opportunity in the coming days, weeks or months depending how long the market takes with this pullback/correction.
If you would like to Receive My ETF Trading Signals please check out my service at: www.TheGoldAndOilGuy.com