Divergence.bot
Buy Domain or
Lease-to-Own

Buy Domain or
Lease-to-Own

![]()
Divergence Trading
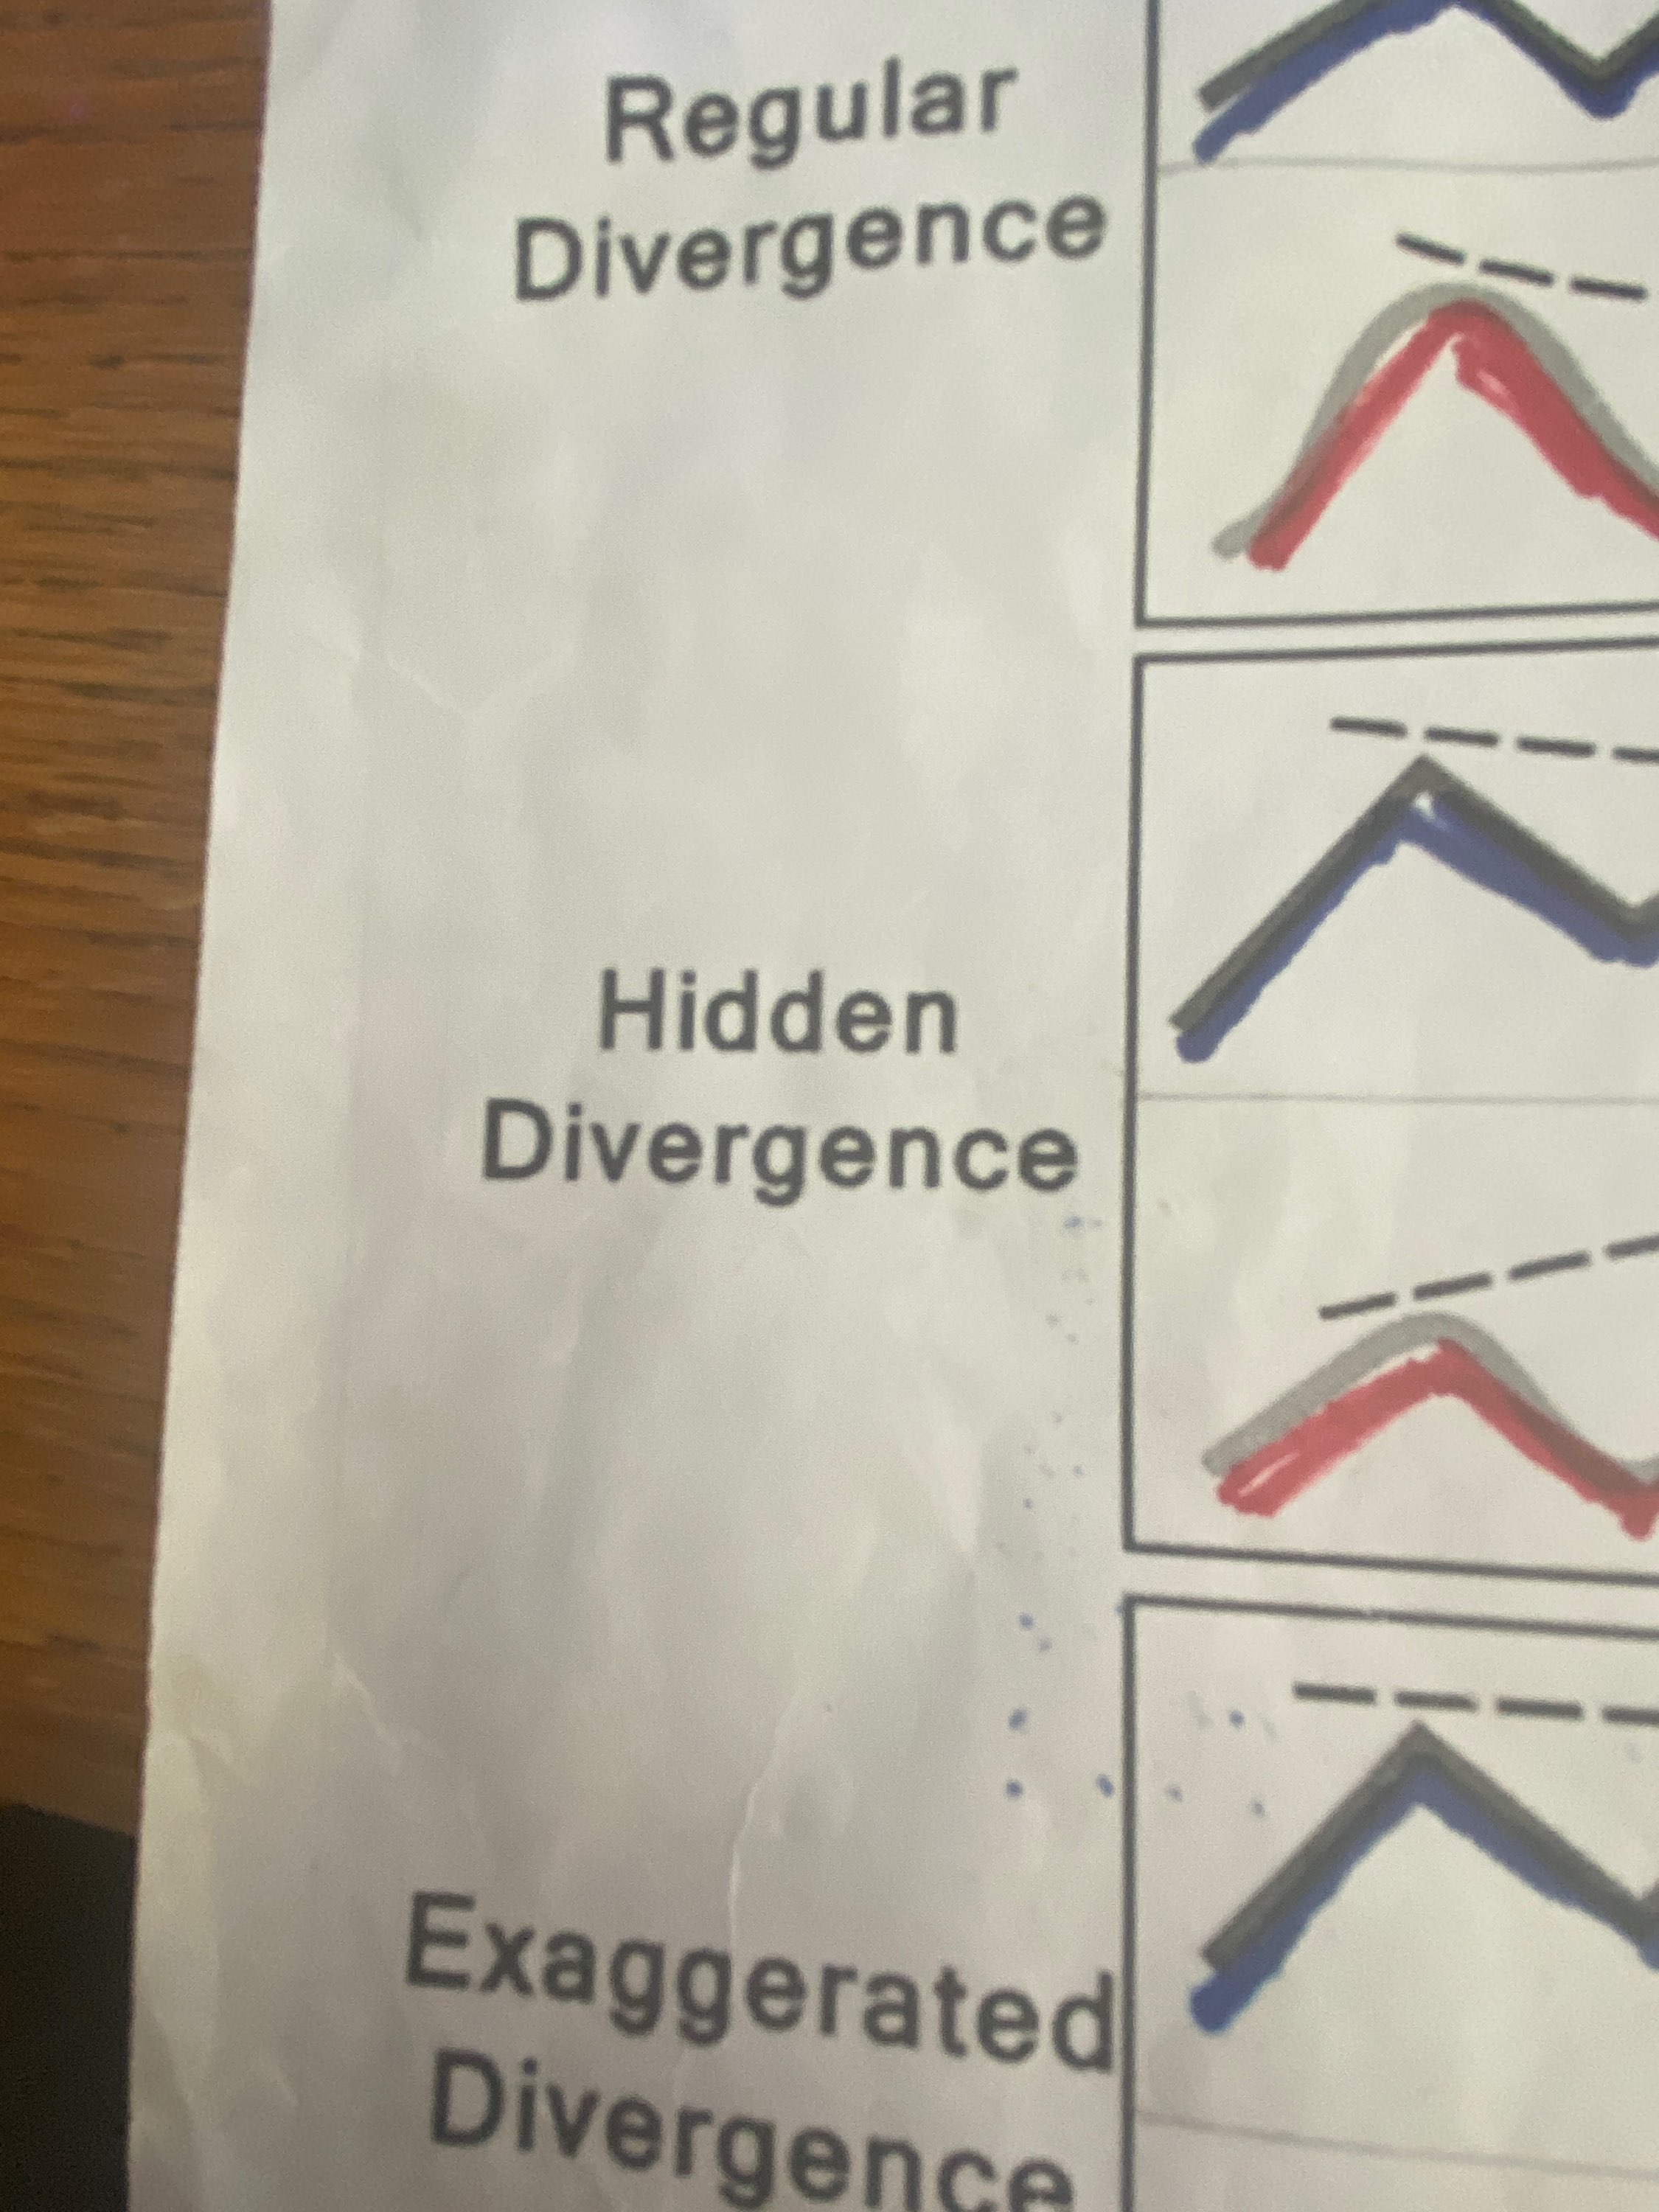
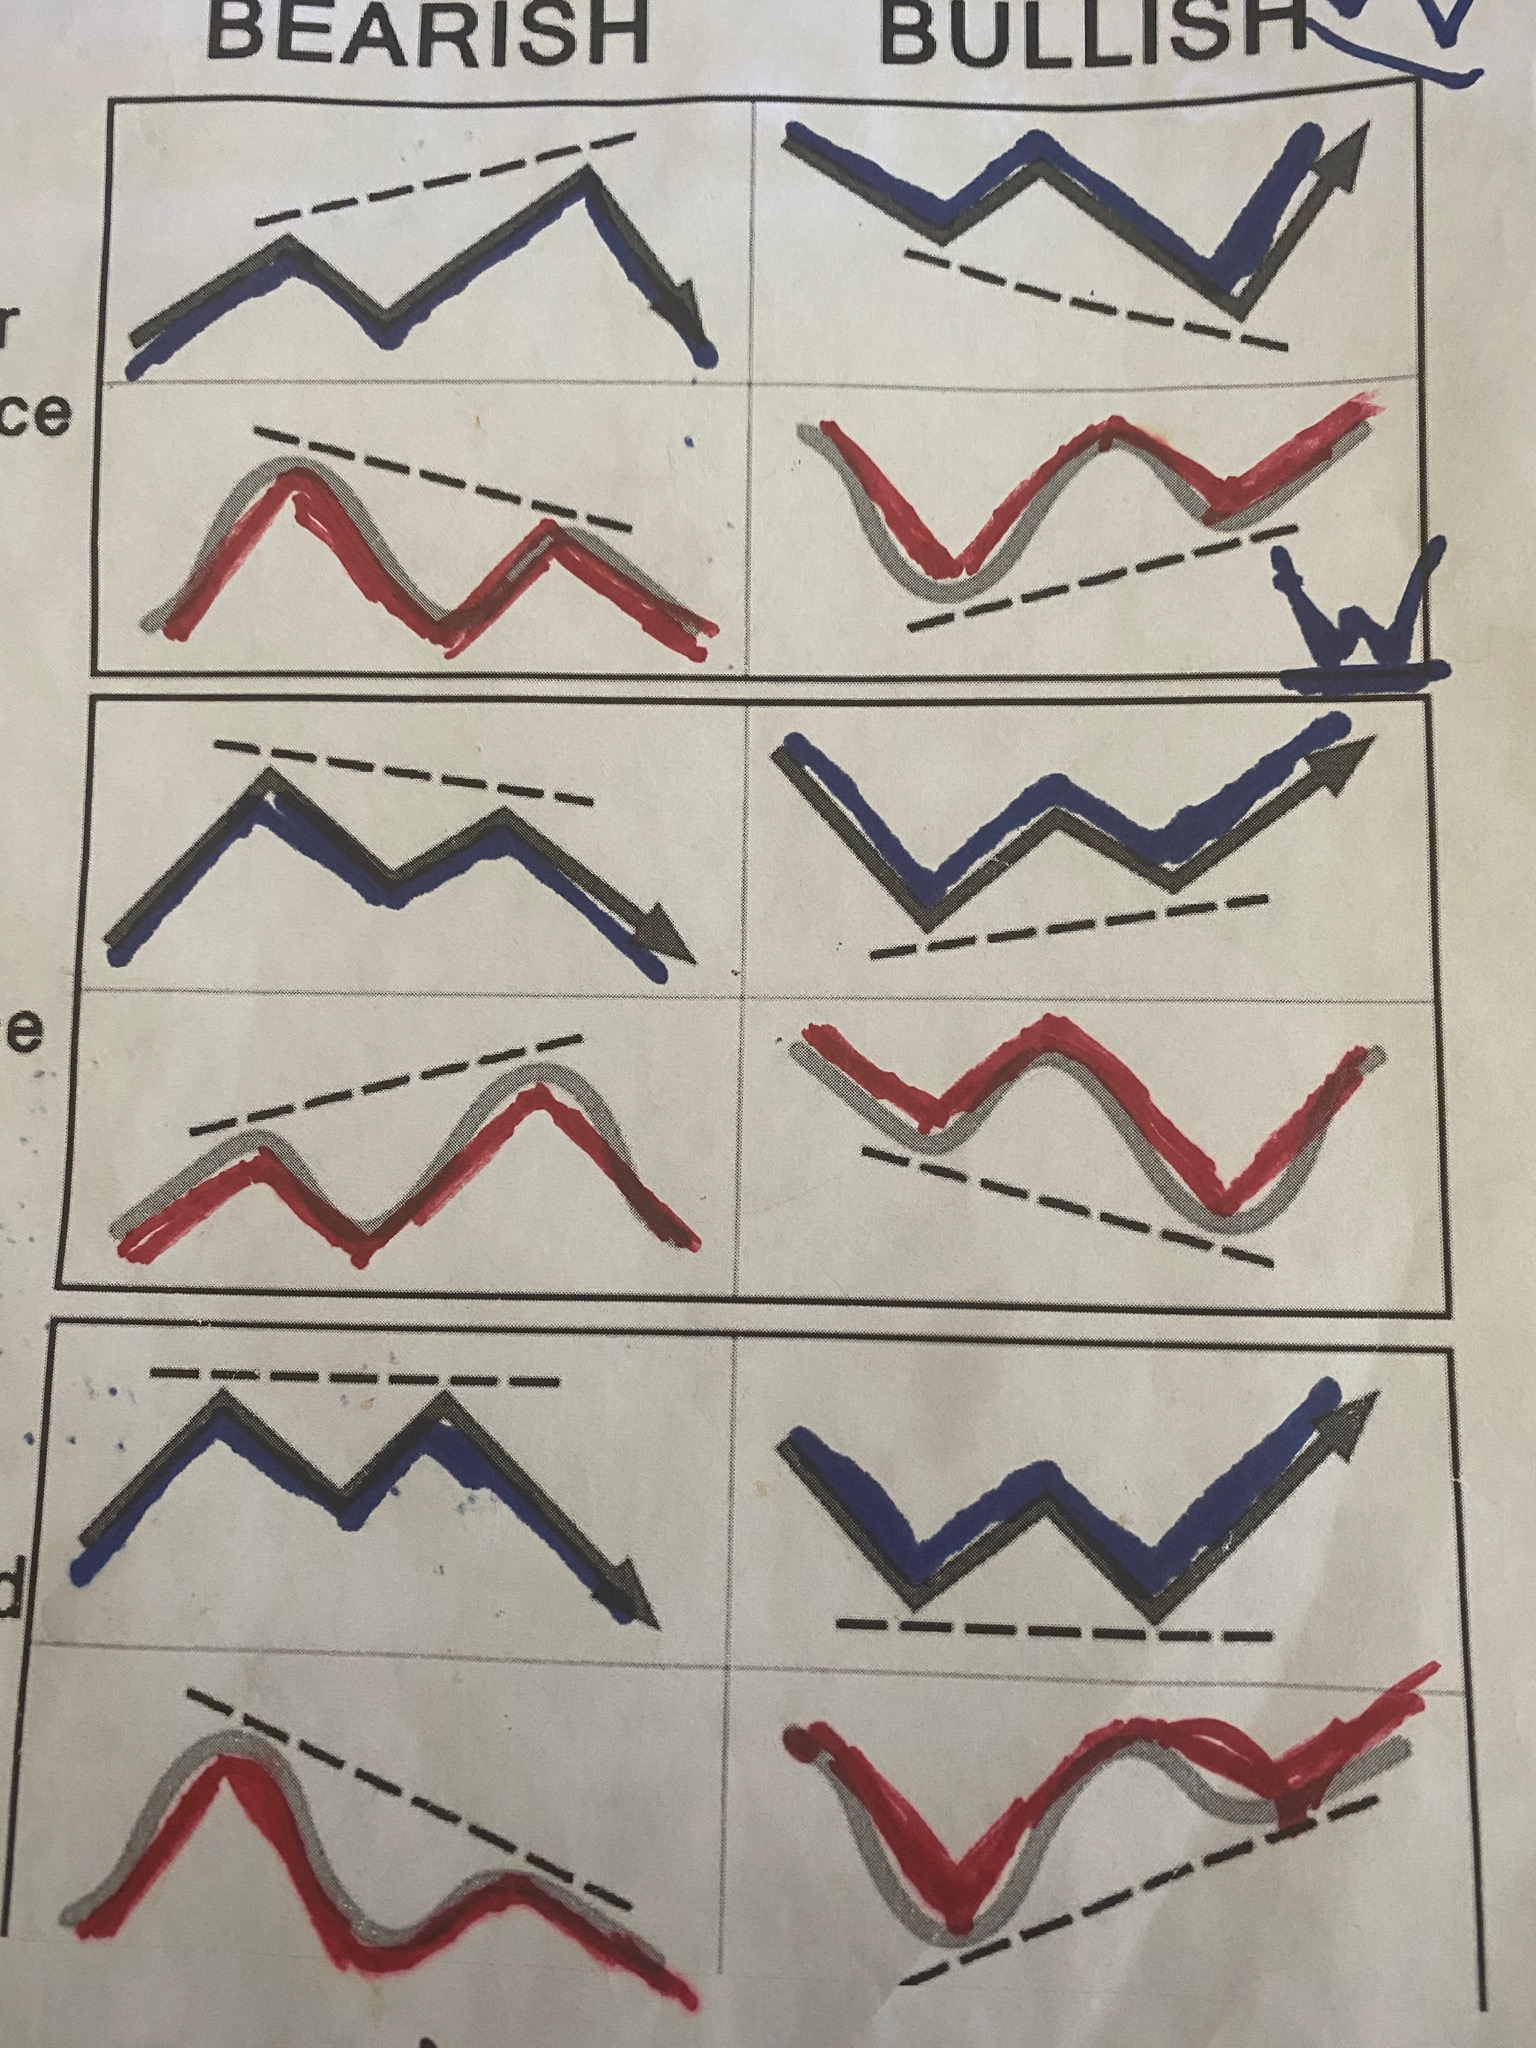
Divergence patterns can be extremely valuable in helping a trader decide if market swing highs and swing lows, pivots and trends are strong or weak. It's relevant in all the markets: i.e., forex, bitcoin, futures markets, commodities, stocks and more. The pictures below (chart on top in black, technical indicator in red below) is a great visual guide to divergence. It's difficult to describe what divergence is in words. We believe the best way to make divergence patterns more understandable and the only good way to do that is by using charts and pictures.


Divergence trading is a popular strategy in technical analysis that involves using price and indicator movements to identify potential reversals in the market.
The information below is associated with divergence trading:
Divergence
Positive Divergence: Occurs when the price makes a lower low, but the indicator makes a higher low.
Negative Divergence: Occurs when the price makes a higher high, but the indicator makes a lower high.
Oscillator Oscillators are commonly used indicators for identifying divergence. Examples include the Relative Strength Index (RSI), Stochastic Oscillator, and Moving Average Convergence Divergence (MACD).
RSI Divergence RSI is a momentum oscillator, and divergence in RSI can signal potential reversals in the price trend.
MACD Divergence MACD is a trend-following momentum indicator, and divergence in MACD can provide signals about the strength of a trend.
Stochastic Divergence The Stochastic Oscillator is used to identify overbought and oversold conditions. Divergence in Stochastic can indicate potential trend reversals.
Hidden Divergence Hidden divergence occurs when the price makes a higher low or lower high, but the indicator shows the opposite movement. It is often used to confirm the continuation of an existing trend.
Regular Divergence Regular divergence is the classical form of divergence where the price and the indicator move in opposite directions, indicating a potential reversal.
Convergence In some cases, traders may look for convergence, where the price and the indicator move in the same direction, supporting the current trend.
Confirmation Traders often seek confirmation from other technical analysis tools or chart patterns to validate divergence signals.
Price Action Price action analysis is crucial when trading divergence, as it helps to confirm signals and identify key support or resistance levels.
Trend Reversal Divergence is often interpreted as a potential indicator of an impending trend reversal in the market.
Risk Management Implementing proper risk management strategies is essential when trading divergence to minimize potential losses.
Timeframes Divergence signals may vary across different timeframes, so traders often consider multiple timeframes for a comprehensive analysis.
Backtesting Traders may use historical data to backtest divergence trading strategies to assess their effectiveness before applying them in live markets.
False Signals Traders should be aware of the possibility of false signals and use additional tools for confirmation before making trading decisions.
Buy or Lease Divergence.bot Today - Contact us Now to make an offer or discuss the possibilities at:


